
A landing page may look good in a presentation but still fail with real users.
The headline may be clear to the team but ignored by visitors. The CTA may look visible but receive no clicks. The form may seem simple but still create friction. This is why heatmap analysis for conversion optimization is valuable.
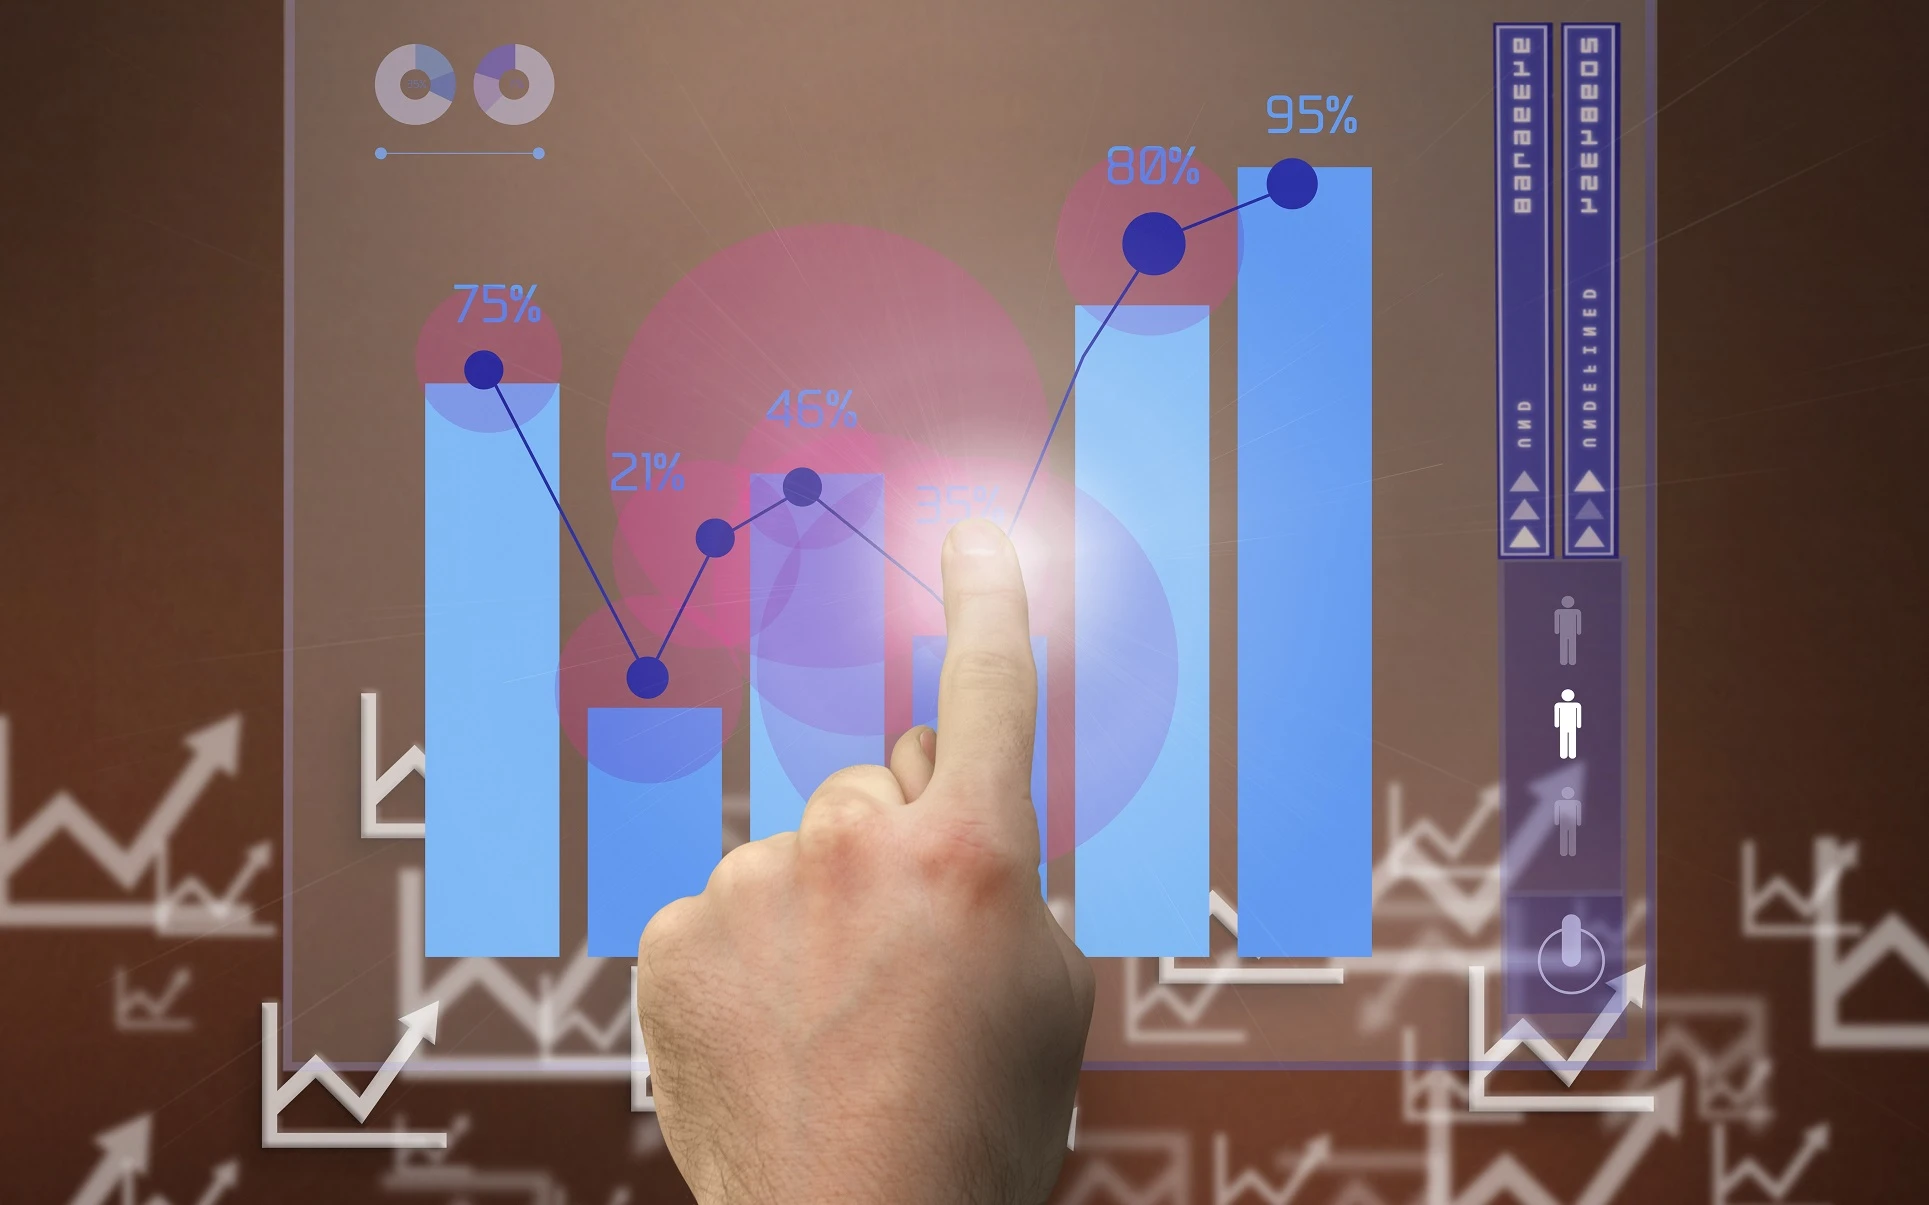
Heatmaps help you understand how users interact with your website visually, showing where they click, scroll, move, tap, and stop engaging. Tools like Microsoft Clarity describe heatmaps as a way to visualize user interactions such as clicks and scrolls, helping teams optimize websites based on actual behavior.
What Is Heatmap Analysis?
Heatmap analysis is the process of reviewing visual user behavior data to identify what attracts attention, what gets ignored, and where users may face friction.
Common heatmap types include:
- Click heatmaps.
- Scroll heatmaps.
- Move heatmaps.
- Tap heatmaps.
- Rage-click reports.
- Engagement zones.
Hotjar lists several heatmap types, including click and tap, move, scroll, engagement, and rage-click heatmaps.
For conversion optimization, the goal is not only to “see where users click.” The real goal is to understand why users are not taking the action you want.

Why Heatmaps Matter for Conversion Optimization
Analytics tools show what happened. Heatmaps help explain how it happened.
Google Analytics can show that a landing page has low conversion rate, high bounce rate, or weak engagement. The GA4 Landing page report shows the first page users land on and helps identify which pages need improvement.
But analytics alone may not show if users missed the CTA, stopped scrolling too early, clicked on a non-clickable element, or became confused by the layout.
Heatmaps add the behavioral layer that helps teams make smarter CRO decisions.
Start with the Conversion Goal
Before opening a heatmap, define the page goal.
Is the page designed to generate form submissions, phone calls, WhatsApp clicks, quote requests, bookings, or demo requests?
A heatmap should be read based on that goal. If users are clicking everywhere except the CTA, the page may be distracting. If users stop scrolling before the offer section, the page may be too slow, too long, or not persuasive enough above the fold.
Without a clear goal, heatmap analysis becomes visual curiosity, not conversion optimization.
Analyze Click Heatmaps
Click heatmaps show where users click on the page.
Look for three main things:
- Are users clicking the main CTA?
- Are they clicking non-clickable elements?
- Are they ignoring important sections?
If users click on images, icons, headings, or cards that are not clickable, they may be expecting interaction. This can be a sign that the design is misleading.
If the CTA receives weak clicks, the problem may be the offer, wording, placement, color contrast, or lack of trust before the button.
Microsoft Clarity also offers click insights such as dead clicks and rage clicks, which can help identify areas where users click but nothing useful happens.
Review Scroll Depth
Scroll heatmaps show how far users move down the page.
This is critical for landing pages because many conversion elements are placed too low. If only a small percentage of users reach the proof section, pricing explanation, testimonials, or form, those sections are not doing enough work.
A strong scroll analysis asks:
- Where do users stop?
- Is the CTA visible before drop-off?
- Are important benefits too low?
- Is the page too long for the traffic source?
- Do mobile users scroll differently than desktop users?
If most users never reach the form, the page may need stronger CTAs earlier or a shorter structure.
Compare Desktop and Mobile Behavior
Mobile and desktop users behave differently.
A page that works well on desktop may fail on mobile because the CTA is buried, the form is hard to complete, or the content order feels too long.
For businesses in Egypt and the Gulf, mobile behavior is especially important because many users browse, compare, and contact brands directly from mobile devices.
Always review separate heatmaps for desktop and mobile. Do not assume one version represents all users.
Identify Distractions
Heatmaps can show if users are distracted by elements that do not support conversion.
This may include:
- Navigation menus.
- Social icons.
- Unrelated service links.
- Decorative visuals.
- Extra buttons.
- Pop-ups.
- Long sections with no action.
A PPC landing page should guide users toward one main conversion. If heatmaps show scattered clicks, the page may need a cleaner path.
Use Heatmaps with Session Recordings
Heatmaps show patterns. Session recordings show individual journeys.
Microsoft Clarity positions itself as a behavior analytics tool that includes both heatmaps and session replays to help teams understand how users interact with websites.
This combination is powerful. If a heatmap shows many rage clicks on a form field, session recordings can show whether the field is broken, confusing, or difficult to use on mobile.
Do not rely on one data source only.
Turn Insights into Actions
Heatmap analysis is only useful when it leads to improvements.
Possible actions include:
- Move the CTA higher.
- Rewrite the headline.
- Shorten the form.
- Make clickable elements clearer.
- Remove distracting links.
- Add trust signals before the CTA.
- Improve mobile layout.
- Split long sections.
- Change page order.
- Create an A/B test.
The goal is not to redesign the whole page blindly. The goal is to make focused changes based on real behavior.
Common Heatmap Mistakes
The biggest mistake is reading heatmaps without enough data. A few visits are not enough to make strong decisions.
Another mistake is treating heatmaps as proof without checking analytics. A section may get many clicks, but if those clicks do not lead to qualified conversions, it may not be valuable.
Teams also make the mistake of focusing on beautiful visuals instead of business outcomes. Heatmaps are not reporting decoration. They are decision tools.
How ProBranding Uses Heatmap Analysis for CRO
At ProBranding, heatmap analysis is part of a complete conversion optimization process.
The work connects landing page strategy, PPC intent, Google Analytics data, heatmaps, session recordings, A/B testing, UX improvements, and lead quality feedback.
For companies in Egypt and the Gulf, this helps turn website decisions from opinions into evidence-based improvements that support better conversions.
Final Thoughts
Heatmap analysis helps you see what users actually do, not what the team assumes they do.
When you understand where users click, where they stop scrolling, what they ignore, and where they struggle, you can make smarter landing page decisions.
Conversion optimization starts with one simple idea: stop guessing and watch the behavior.